Your Guide to
Technical Views
TC Technical Views is your go-to tool for discovering trade ideas with clear trend lines, extensive market coverage, and expert analysis that’s regularly updated.
Tất cả các giao dịch đều có rủi ro.
Nó có thể làm mất tất cả vốn của bạn.
TC Technical Views is your go-to tool for discovering trade ideas with clear trend lines, extensive market coverage, and expert analysis that’s regularly updated.
The signature chart
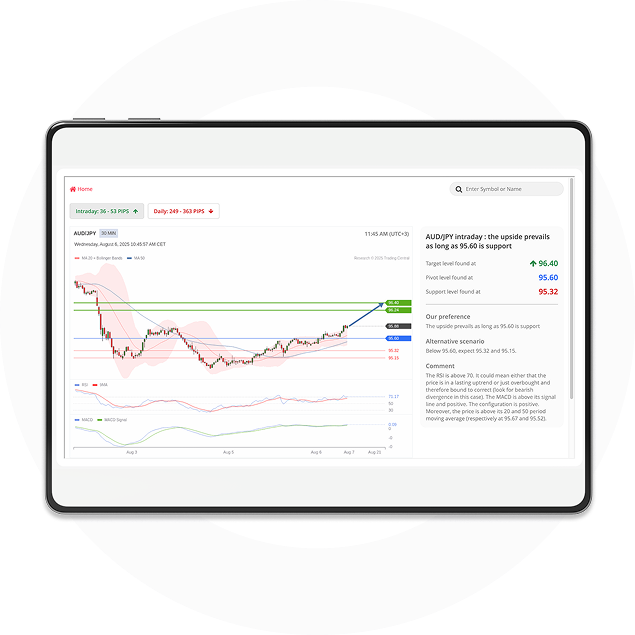
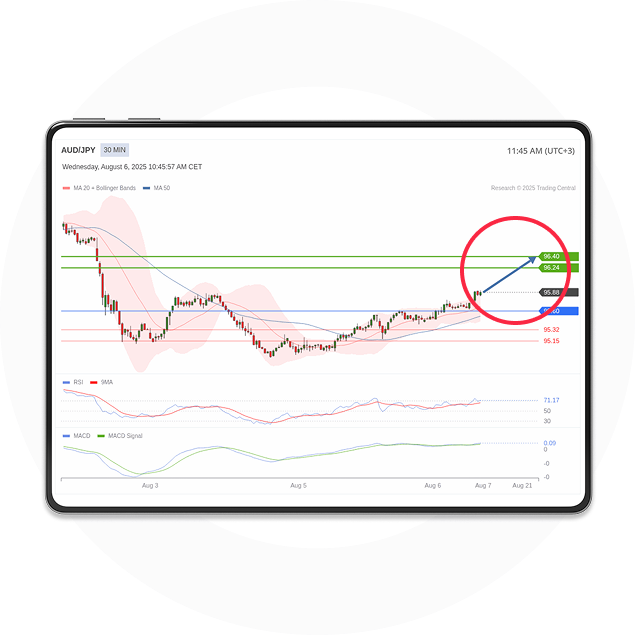
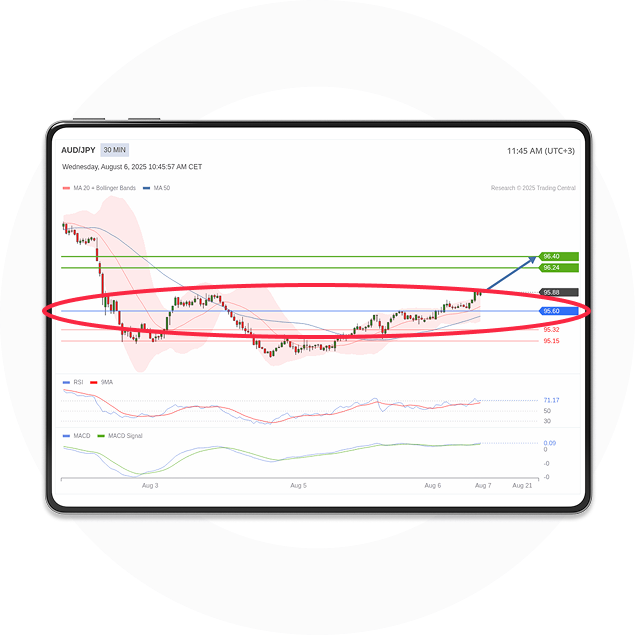
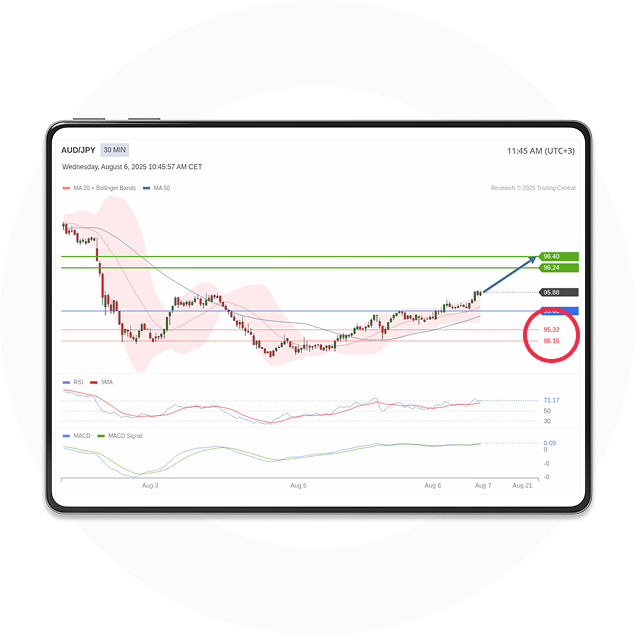
This is a Trading Central signature chart, featuring indicators, patterns or trend lines plotted directly on the price chart. It offers an insight into the technical analysis methodology.
But for now, let’s focus on what matters most: the actionable insights it delivers.
Know where the price is headed
The bold blue arrow gives you an instant and clear indication of direction, showing the expected price direction. In this case, it points to a potential upward move.
The preferred scenario holds only as long as the price stays above the blue pivot line. If the price crosses the pivot line, the alternative scenario takes over and prices are expected to reverse in the opposite direction.
Stops help protect your capital: Many traders use the pivot level as a stop price to protect their positions. If the price reaches this level, it means the reason for the position no longer applies, so they exit their position to limit losses.
Plan your success targets
This website is not directed at EU residents and falls outside the European and MiFID II regulatory framework.
Please click below if you wish to continue to FXCess anyway.
This website is not directed at UK residents and falls outside the European and MiFID II regulatory framework, as well as the rules, guidance and protections set out in the UK Financial Conduct Authority Handbook.
Please click below if you wish to continue to FXCess anyway.